In Part 1 we set up basic monitoring and a CPU alarm, and in Part 2 we added memory and disk monitoring with the CloudWatch Agent. By now we’re collecting CPU, memory, disk, and network metrics — but checking them means clicking around all over the place.
In this post we’ll organize every metric onto a single screen with a CloudWatch dashboard, collect server logs with CloudWatch Logs, and complete the EC2 monitoring system.
Creating a CloudWatch Dashboard
A dashboard is a screen where multiple metrics are laid out as widgets so you can see everything at a glance. Let’s gather the metrics you really need to understand the state of an EC2 instance.
Create the dashboard
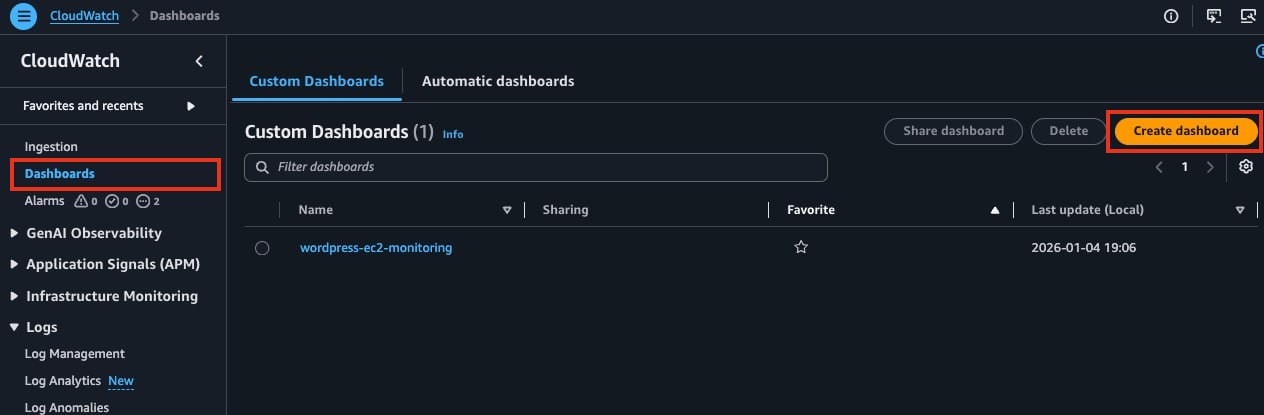
Go to the CloudWatch service in the AWS console
Click Dashboards in the left menu
Click the Create dashboard button
Enter a dashboard name: EC2-Monitoring (something easy to recognize)
Click Create dashboard
Widget types
These are the widget types you can add to a dashboard.
Widget
Purpose
When to use
Line
Track changes over time
CPU and memory usage trends
Number
Show the current value
Current disk usage
Gauge
Current state against a threshold
Memory usage warning level
Bar
Comparisons
Comparing multiple instances
Text
Notes and links
Dashboard documentation
Logs table
Log query results
Recent error logs
In this post I mainly use the Line widget. It’s great for seeing trends over time and it’s the most versatile.
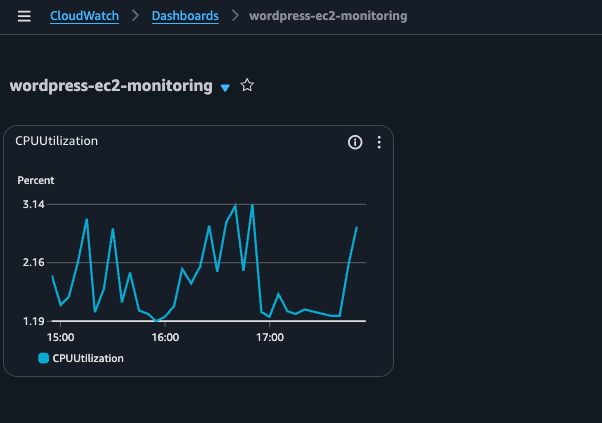
Add a CPU utilization widget
Click Add widget or the + button
Select Line > Next
Select the Metrics tab
Click EC2 > Per-Instance Metrics
Check CPUUtilization for the target instance
Click Create widget
Add a memory availability widget
Add widget > Line > Next
Click CWAgent > InstanceId
Check mem_available_percent
Click Create widget
💡 mem_used_percent vs mem_available_percent
As explained in Part 2, mem_available_percent more accurately reflects the memory that’s actually available. I recommend using this metric on the dashboard as well.
Add a disk usage widget
Add widget > Line > Next
Click CWAgent > InstanceId, device, fstype, path
Check disk_used_percent
Click Create widget
Add a network I/O widget
Add widget > Line > Next
Click EC2 > Per-Instance Metrics
Check NetworkIn and NetworkOut (both metrics on the same widget)
Click Create widget
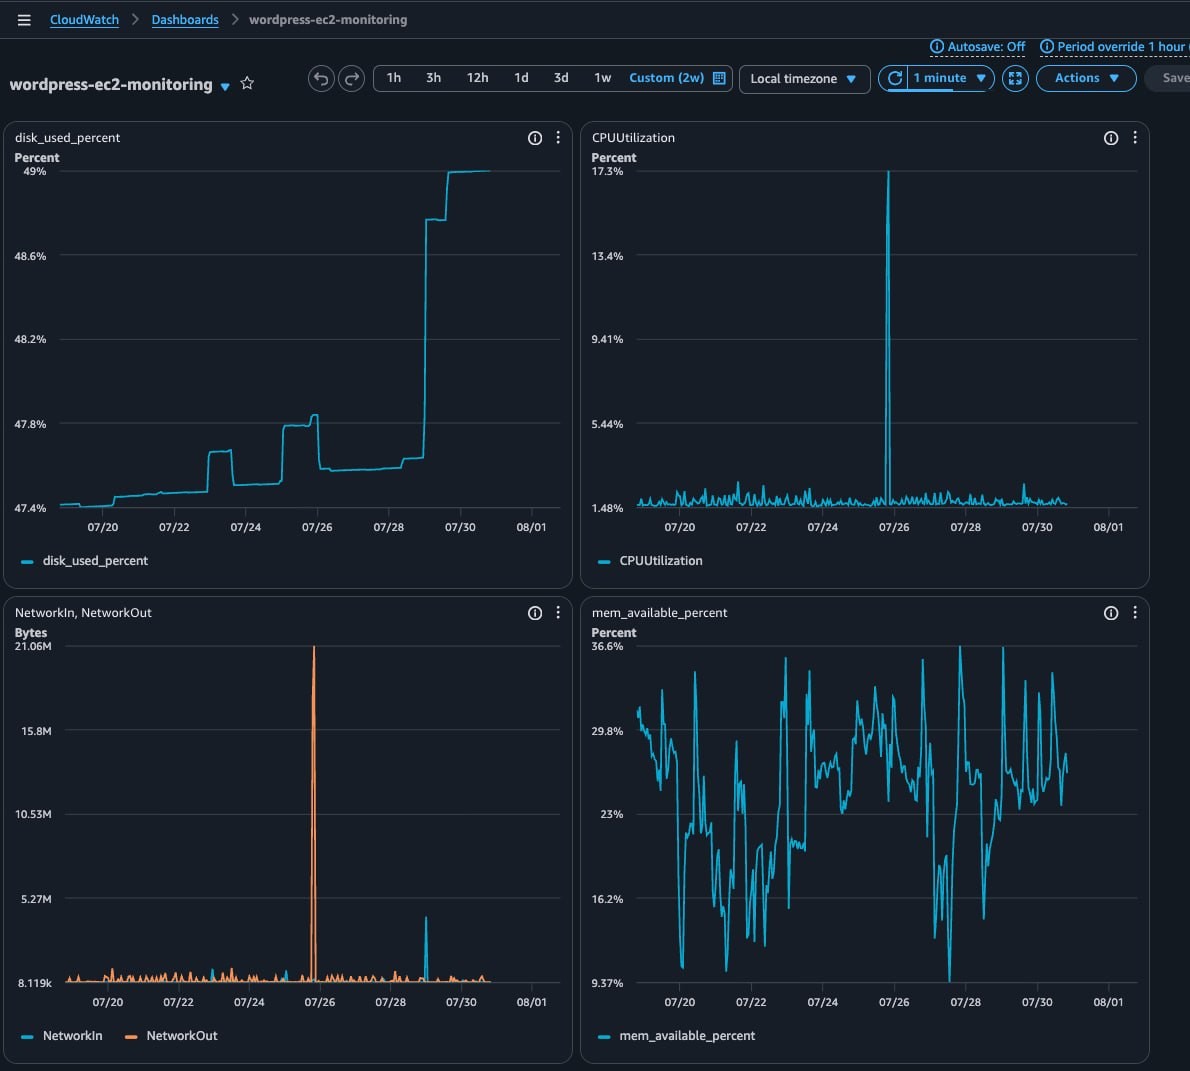
Arrange the dashboard layout
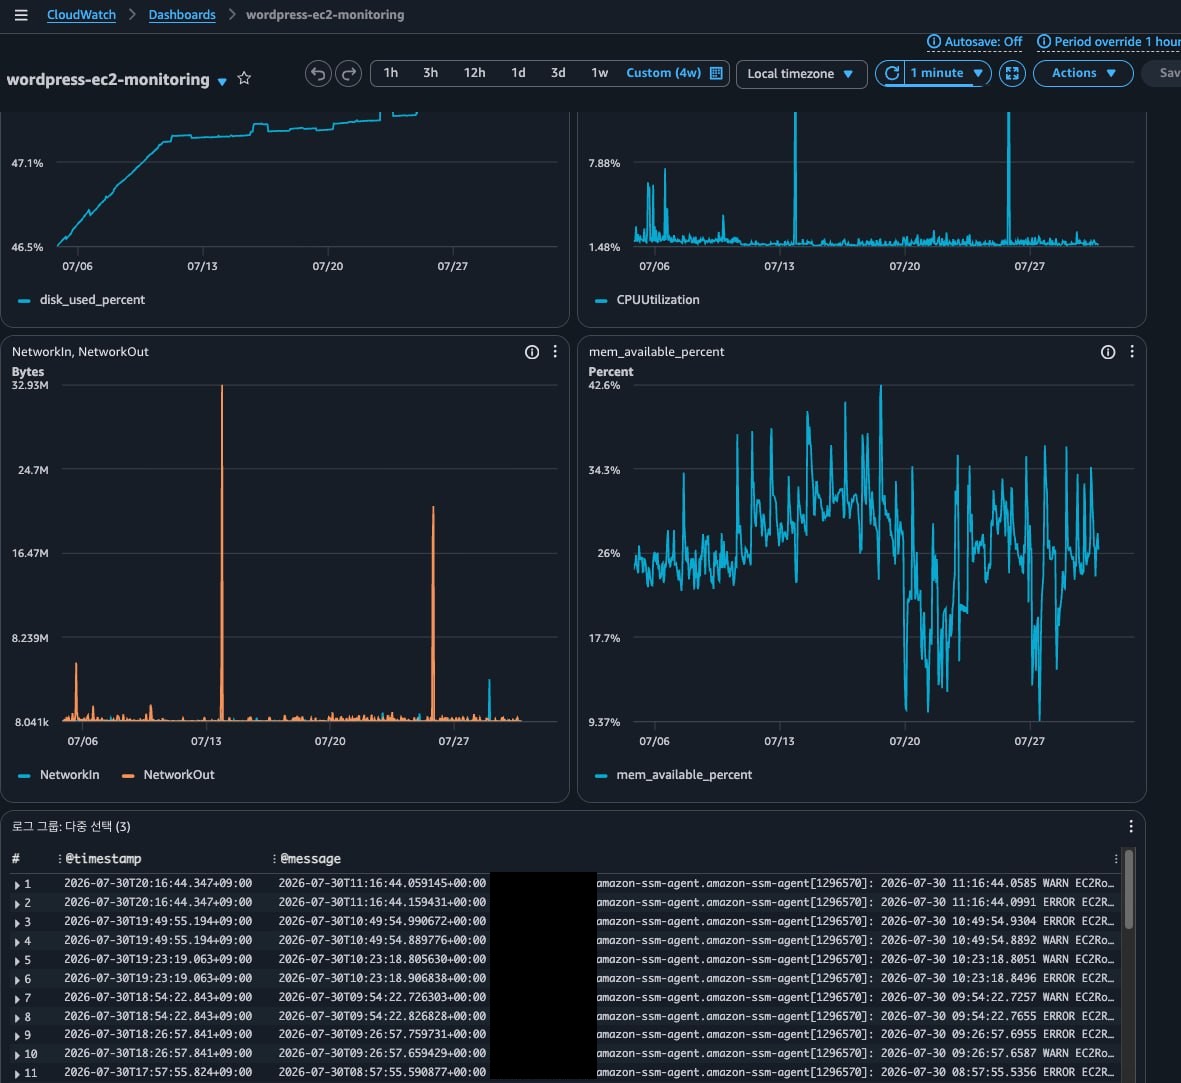
You can drag the widgets into whatever positions you like. Here’s an example layout:
flowchart LR
    subgraph DASH["📊 EC2-Monitoring dashboard"]
        subgraph L[" "]
            direction TB
            W1["Disk usage<br/>(CWAgent)"]
            W2["Network I/O<br/>(EC2)"]
        end
        subgraph R[" "]
            direction TB
            W3["CPU usage<br/>(EC2)"]
            W4["Memory available<br/>(CWAgent)"]
        end
    end
Once you’re done arranging, make sure to click the Save button at the top right.
Set the time range
You can set the time range at the top of the dashboard.
1h, 3h, 12h: checking recent issues
1d, 3d, 1w: trend analysis
Custom: a specific period
The default is 3 hours (3h). Adjust it to fit your use case.
Auto refresh
In the dropdown next to the refresh icon at the top right, you can set the auto-refresh interval.
Off: manual refresh only
10s, 1m, 2m, 5m, 15m: auto refresh
I recommend 10 seconds if you need real-time monitoring, and 5 minutes for general use.
CloudWatch Logs Basics
With the dashboard, metrics are now visible at a glance. Next, let’s collect the logs the server produces.
Why collect logs?
There’s information that metrics alone can’t tell you.
Situation
Metrics
Logs
”CPU suddenly spiked — what caused it?”
Can see CPU at 100%
Can see which process/request caused it
”Who logged into the server?”
Not available
SSH login history
”The application threw an error…”
Not available
Error messages and stack traces
Log groups and log streams
Understanding the structure of CloudWatch Logs makes the setup easier.
CloudWatch Logs
└── Log Group: /ec2/syslog
├── Log Stream: i-0abc123... (instance 1)
├── Log Stream: i-0def456... (instance 2)
└── Log Stream: i-0ghi789... (instance 3)
Log group: a container that groups logs of the same kind (e.g. syslog, nginx-access)
Log stream: a per-source subdivision within a log group (e.g. per instance)
Set a retention period
Logs cost money based on how much you store. You can set a retention period per log group in the CloudWatch console.
Where: CloudWatch > Logs > Log groups > select a log group > Actions > Edit retention setting
Retention
Use case
1 day – 1 week
Debugging, temporary logs
1 month
General operational logs
3 months – 1 year
Audit, compliance
Never expire
Long-term archiving (watch the cost)
The default is Never expire, so it’s a good idea to set an appropriate retention period to keep costs under control.
Configuring Log Collection with the Agent
The CloudWatch Agent we installed in Part 2 can collect logs too. All you need is to add a logs section to the existing config file.
Edit config.json
Open the existing config.json and add a logs section.
If you don’t specify run_as_user, the CloudWatch Agent runs with its default: root privileges. Running as root lets it read most log files — /var/log/syslog, /var/log/auth.log, Docker logs, and so on — without any extra permission setup. (See the AWS docs↗.)
If you configure the agent with the wizard, it sets "run_as_user": "cwagent" by default, which can cause permission problems. In that case, see the troubleshooting section.
Log configuration fields explained
Field
Description
Example
file_path
Path of the log file to collect
/var/log/syslog
log_group_name
CloudWatch log group name
/ec2/syslog
log_stream_name
Log stream name (set automatically via {instance_id})
i-0abc123def456
timestamp_format
Timestamp format of the log
%b %d %H:%M:%S
💡 timestamp_format
syslog timestamps look like Jan 5 14:30:00. To parse them we use %b %d %H:%M:%S.
%b: abbreviated month name (Jan, Feb, …)
%d: day of the month (01-31)
%H:%M:%S: hours:minutes:seconds
💡 Placeholder syntax differs between metrics and logs
When you use dynamic values in config.json, the syntax differs by section:
You can add multiple logs to the collect_list array.
"collect_list": [
{
"file_path": "/var/log/syslog",
"log_group_name": "/ec2/syslog",
"log_stream_name": "{instance_id}",
"timestamp_format": "%b %d %H:%M:%S"
},
{
"file_path": "/var/log/auth.log",
"log_group_name": "/ec2/auth",
"log_stream_name": "{instance_id}",
"timestamp_format": "%b %d %H:%M:%S"
}
]
Collecting Docker WordPress/MySQL logs
If you run WordPress and MySQL with Docker Compose, you can collect the container logs too. I recommend keeping Docker’s default approach (the json-file driver) and collecting with the Agent — that way the docker logs command keeps working as well.
Limit Docker log size
Docker has no log size limit by default, so your disk can fill up. Cap the log size in docker-compose.yml.
# docker-compose.yml example
services:
wordpress:
image: wordpress
container_name: wordpress
logging:
driver: "json-file"
options:
max-size: "10m"# max 10MB per file
max-file: "3"# keep at most 3 files
# ... rest of the config
db:
image: mysql:8.0
container_name: wordpress-db
logging:
driver: "json-file"
options:
max-size: "10m"
max-file: "3"
# ... rest of the config
💡 How max-size and max-file work
max-size: "10m": the log file rotates automatically once it reaches 10MB
max-file: "3": keep at most 3 files (xxx-json.log, xxx-json.log.1, xxx-json.log.2)
Docker handles the rotation itself, so no separate logrotate setup is needed
Max disk usage per container = 10MB × 3 = 30MB
Recreate the containers after changing the config:
Terminal window
dockercomposedown
dockercomposeup-d
💡 docker-compose vs docker compose
docker-compose (with a hyphen) is V1, which reached end of support in June 2023↗. The current standard is V2, invoked as docker compose (with a space).
Add Docker logs to the CloudWatch Agent config
Add the Docker logs to collect_list in config.json.
With 2-3 containers, yes. The Agent pushes only the most recently modified file↗ based on modification time, and files with no changes are merely scanned, not actually read. WordPress + MySQL = 2 containers, so the CPU overhead is small.
Also, when you run docker compose down, the /var/lib/docker/containers/<container-id>/ directory is deleted along with the container — including the log files. In other words, the number of log files always matches the number of currently running containers.
That said, avoid ** (the recursive wildcard) — it scans entire subdirectory trees and can drive up CPU usage↗. Stick to a single * at each path level, as in the path above.
⚠️ Beware of log loss on docker compose down
Command
Containers
Log files
docker compose stop
Stopped (kept)
Kept
docker compose down
Deleted
Deleted
docker compose restart
Restarted
Kept
When you run down, the containers are deleted and the log files go with them↗. Important logs need to already be in CloudWatch Logs. Since the Agent collects in real time this is mostly fine, but logs written right before deletion may not have been shipped yet.
Ubuntu system log defaults (for reference)
syslog and auth.log are managed automatically by Ubuntu’s logrotate. To check the default settings:
The CloudWatch Agent only collects the currently active files (syslog, auth.log), so rotated files (.1, .gz) are not collected. If you need older logs, look them up in CloudWatch Logs.
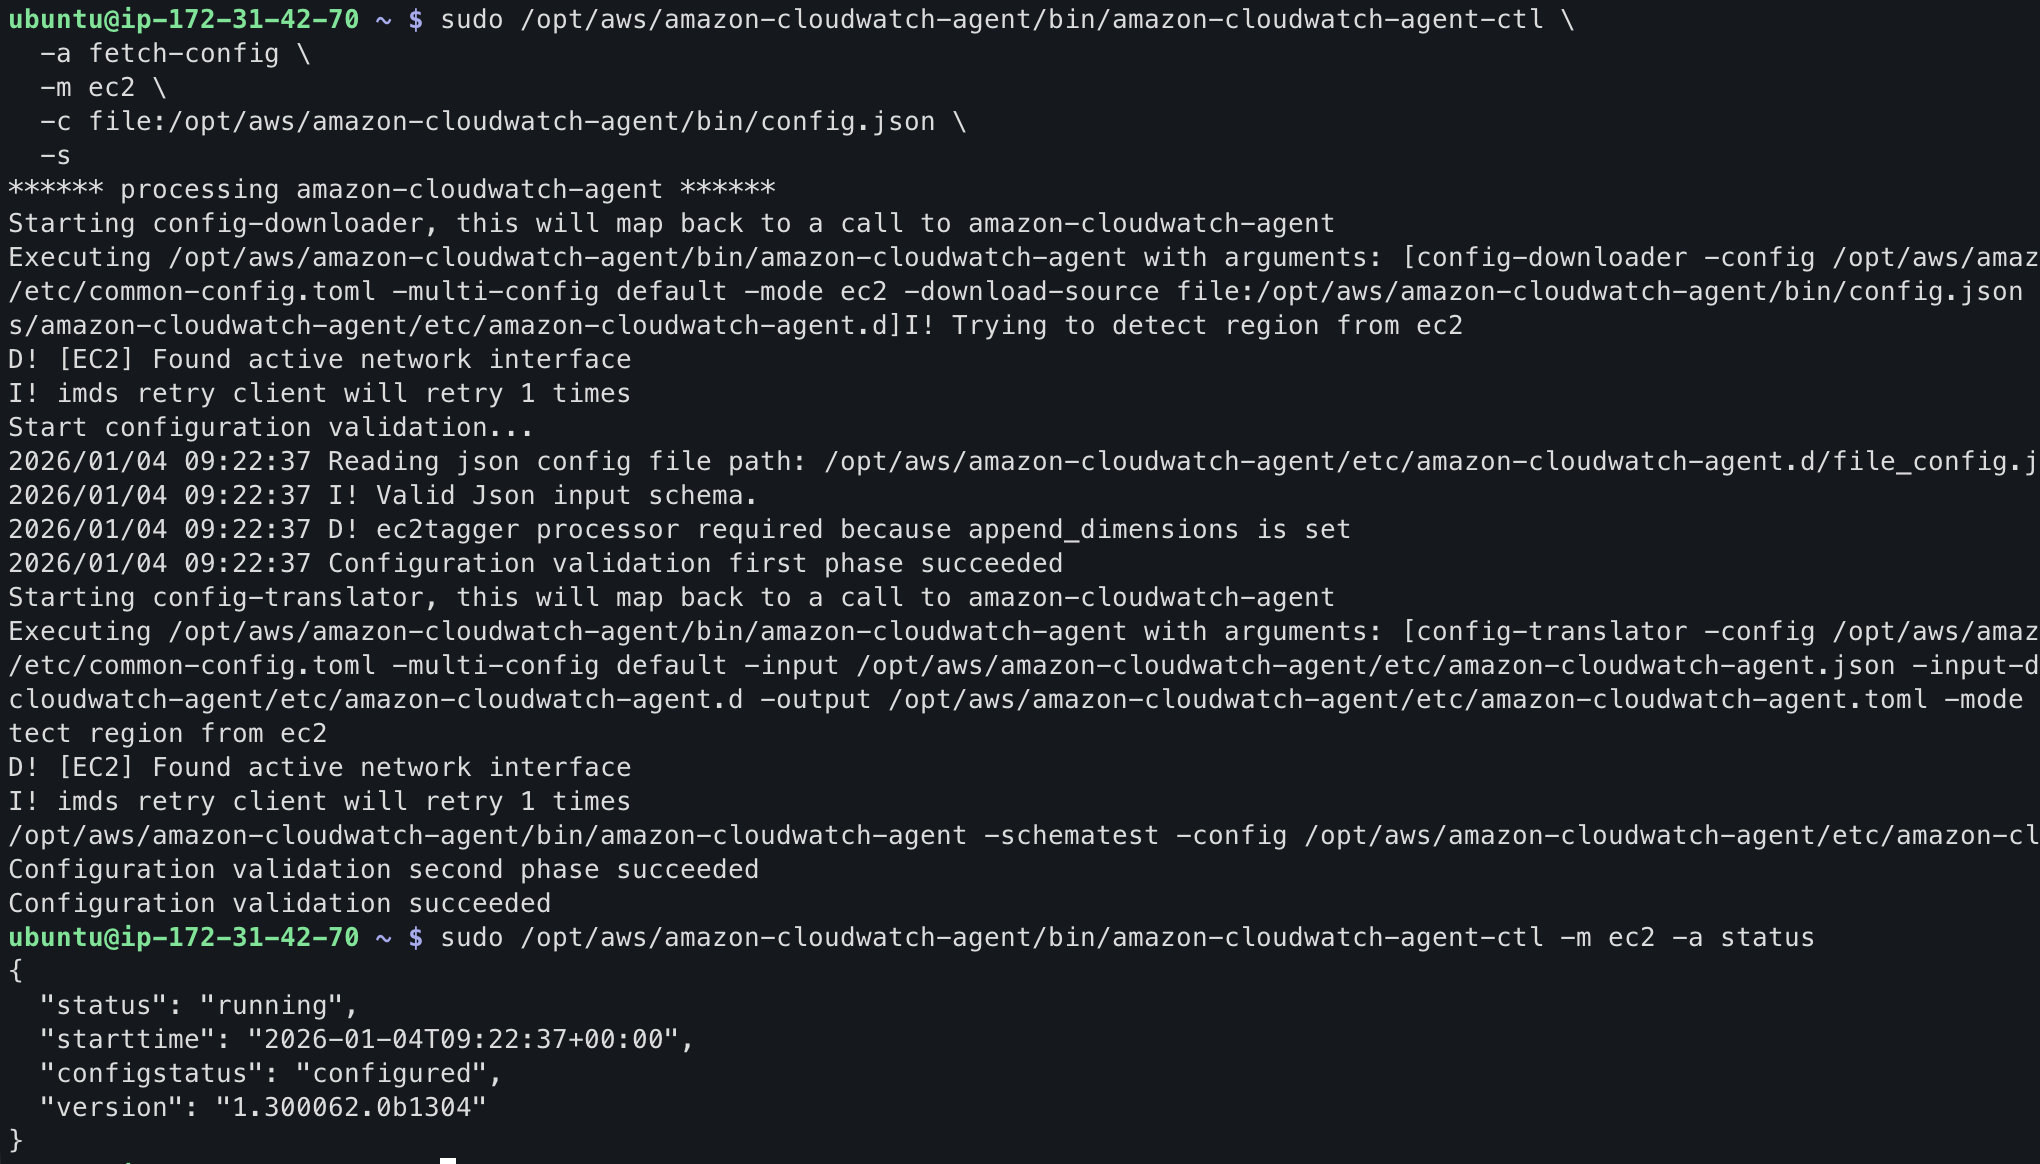
Restart the Agent
After editing the config file, the Agent must be restarted for the changes to take effect.
Once the Agent is running properly, the logs show up in CloudWatch Logs after 1-2 minutes.
Check the log group
Go to the CloudWatch service in the AWS console
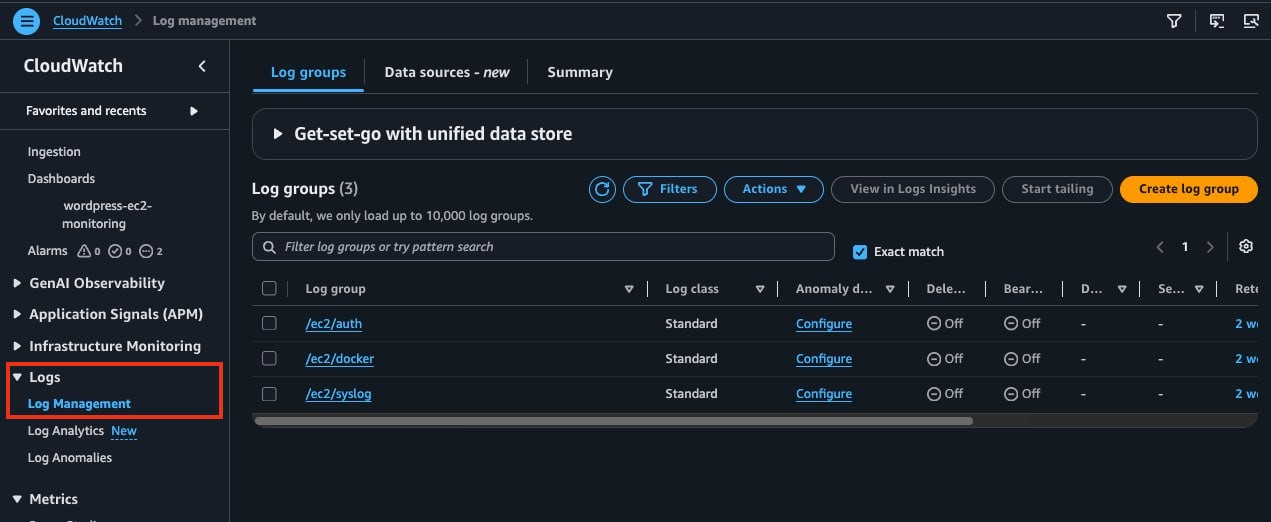
Click Logs > Log Management in the left menu
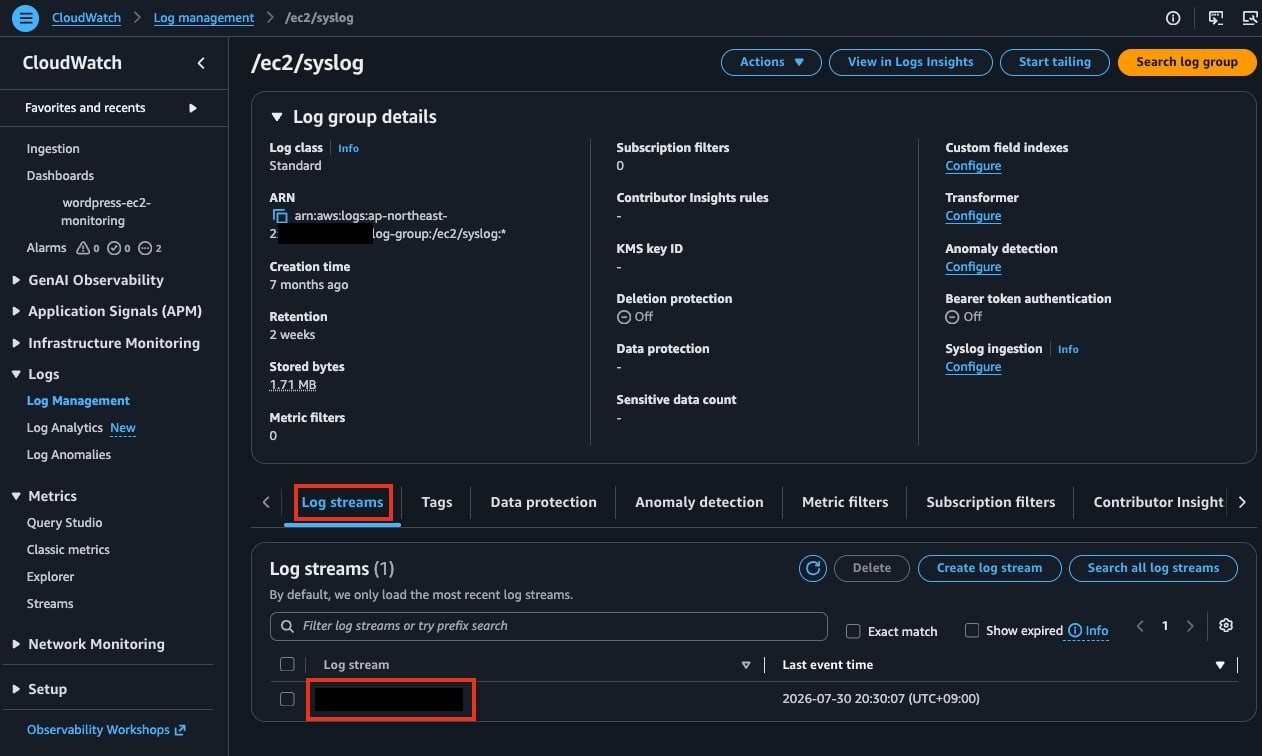
Click the /ec2/syslog log group
View logs in the log stream
Inside the log group, click the log stream named after the instance ID
Check the list of log events
Set the retention period
Select the log group
Click Actions > Edit retention setting
Choose the retention period you want (e.g. 1 month)
Click Save
Analyzing Logs with CloudWatch Logs Insights
As logs pile up, finding what you want gets harder. Logs Insights lets you search and analyze logs with SQL-like queries.
Getting started with Logs Insights
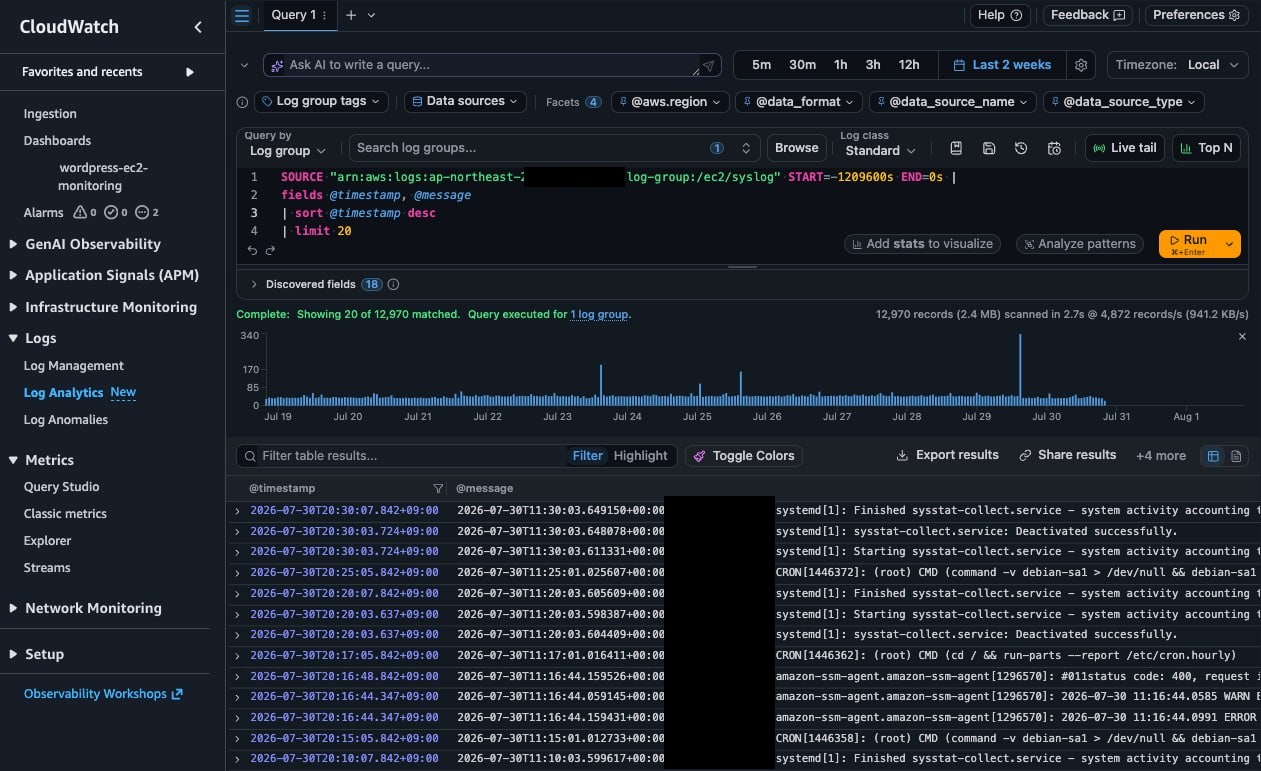
Click Logs > Logs Insights in the CloudWatch left menu
Select a log group: /ec2/syslog
Set a time range (e.g. 1 hour)
The default query
When you first open Logs Insights, a default query is shown.
fields @timestamp, @message
| sort @timestamp desc
| limit 20
This query means “show me the 20 most recent logs in reverse chronological order.”
Click the Run query button and the results appear.
Query syntax
Command
Description
SQL equivalent
fields
Select fields to display
SELECT
filter
Filter by condition
WHERE
sort
Sort
ORDER BY
limit
Limit the result count
LIMIT
stats
Aggregate functions
GROUP BY + aggregates
Practical query examples
1. Find error logs
fields @timestamp, @message
| filter @message like /(?i)error/
| sort @timestamp desc
| limit 50
The (?i) flag makes the match case-insensitive, so this finds logs containing “error” in any casing.
2. Check SSH login attempts (if you collect auth.log)
fields @timestamp, @message
| filter @message like /sshd/
| filter @message like /Accepted|Failed/
| sort @timestamp desc
| limit 50
3. Aggregate logs by time bucket
fields @timestamp, @message
| stats count(*) as count by bin(1h)
| sort @timestamp desc
This counts log events per hour. Useful for spotting anomalies.
4. Search while excluding a keyword
fields @timestamp, @message
| filter @message not like /CRON/
| sort @timestamp desc
| limit 50
This searches while excluding the CRON logs that run on a schedule.
Saving queries
Saving your frequently used queries is convenient.
Write the query, then click the Save button
Enter a query name (e.g. “Error log search”)
Click Save
Saved queries can be loaded from the Saved queries panel on the right.
Adding a Log Widget to the Dashboard
You can add Logs Insights query results to your dashboard.
Add the log widget
Run the query you want in Logs Insights
Click Actions > Add to dashboard
Select the dashboard: EC2-Monitoring
Enter a widget name (e.g. “Recent error logs”)
Click Add to dashboard
Now the dashboard shows your logs right next to your metrics, all in one view.
Cost Considerations
CloudWatch Logs charges at each stage: ingestion, storage, and analysis.
Free Tier limits
CloudWatch’s free allowance is Always Free — it continues to apply even after the first 12 months. (See the AWS CloudWatch pricing page↗.)
Item
Free allowance
Type
Log ingestion
5GB/month
Always Free
Log storage
5GB/month
Always Free
Logs Insights queries
5GB scanned/month
Always Free
💡 What does Always Free mean?
The AWS Free Tier comes in three types↗: 12 months free, short-term trials, and Always Free. CloudWatch logs fall under Always Free, so you get 5GB per month at no charge even after your AWS account is more than 12 months old.
What you pay beyond that (Seoul region)
Item
Price
Log ingestion
$0.76/GB
Log storage
$0.0314/GB/month
Logs Insights queries
$0.0076/GB scanned
Cost-saving tips
Set a retention period: pick something sensible like 1 month instead of Never expire
Collect only the logs you need: select what matters instead of everything
Watch out for wildcards: * in file_path can collect more logs than you expect
Limit Logs Insights time ranges: query only the time window you actually need
💡 Estimating log volume
For syslog on a t3.micro, expect roughly 10-50MB per day. That’s about 300MB-1.5GB per month — comfortably within the Free Tier. But be careful: if you also collect application logs, the volume can grow significantly.
If you see a Permission denied error, the problem is read permission on the log file.
2. Check the IAM role
The CloudWatchAgentServerPolicy we attached in Part 2 includes log write permissions. Make sure the role is properly attached.
3. Check the log file path
Terminal window
# Check that the file exists
ls-la/var/log/syslog
# Check recent logs
tail-10/var/log/syslog
Logs Insights queries return no results
Check the time range: make sure the query’s time range covers when the logs were collected
Check the log group: make sure you selected the right log group
Check the filter conditions: make sure your filter isn’t too restrictive
Log permission issues when configuring via the wizard
If you generate config.json with amazon-cloudwatch-agent-config-wizard, it sets "run_as_user": "cwagent" by default. The cwagent user has no permission to read system logs or Docker logs, so log collection can silently fail.
Confirming the symptom
If the Agent log doesn’t print a piping log from message for a given log file, it’s a permission problem.
# Healthy: a piping message is printed for each log file
# I! [logagent] piping log from /ec2/syslog/...
# I! [logagent] piping log from /ec2/auth/...
Fix 1: Remove run_as_user (recommended)
If you remove the run_as_user setting, as in this post, the Agent runs as root and can read all logs.
{
"agent": {
"metrics_collection_interval": 60
},
...
}
Fix 2: Add the cwagent user to groups
If you want to keep the cwagent user for security reasons, grant the necessary group permissions.
Terminal window
# Read access to syslog and auth.log (adm group)
sudousermod-aGadmcwagent
# Restart the Agent so the group change takes effect
sudosystemctlrestartamazon-cloudwatch-agent
⚠️ Group membership does not fix Docker logs
The /var/lib/docker/containers/ directory is owned by root:root and its group permission is --x (execute only). Even if you add cwagent to the docker group, it has no read permission and log collection won’t work.
To collect Docker logs, use Fix 1 (remove run_as_user), or grant permissions directly with ACLs:
If you’re collecting Docker logs too, I recommend Fix 1. The CloudWatch Agent is official AWS software and only reads and ships logs, so running it as root isn’t a major security concern.
Wrap-up
Here’s a recap of what we covered in this post.
A CloudWatch dashboard is a screen where multiple metrics are laid out as widgets for at-a-glance visibility. By gathering CPU, memory, disk, and network metrics on one dashboard, you can quickly assess the state of your EC2 instance.
CloudWatch Logs is the service that collects and stores server logs. Add a logs section to the CloudWatch Agent’s config.json and you can collect any log file you want.
Logs Insights lets you search and analyze the collected logs with queries. Its SQL-like syntax handles things like finding error logs and analyzing patterns.
Cost: log ingestion is free up to 5GB/month, and syslog on a t3.micro stays comfortably within the Free Tier.
The EC2 Monitoring Series Is Complete! 🎉
Over three posts, we’ve built out a complete EC2 monitoring system.
You now have a monitoring setup that shows the CPU, memory, disk, and network state of your EC2 instance at a glance, alerts you when something goes wrong, and lets you dig into the logs to find the cause.