AWS EC2 Monitoring Guide (1) – Checking Server Health with CloudWatch
Contents
- I Launched an EC2 Instance — How Do I Know If the Server Dies?
- A Look at the EC2 Monitoring Tab
- Metrics Provided by Default
- Basic Monitoring vs. Detailed Monitoring
- What’s Actually Different
- What Detailed Monitoring Costs
- What Is CloudWatch?
- CloudWatch’s Core Features
- Understanding the EC2 Monitoring Architecture
- Understanding the CloudWatch Free Tier
- CloudWatch Free Tier (Always Free)
- Checking Metrics in the CloudWatch Console
- Opening the CloudWatch Console
- Finding EC2 Metrics
- Viewing the CPU Utilization Graph
- Creating a CPU Utilization Alarm
- Step 1: Start Creating the Alarm
- Step 2: Select the Metric
- Step 3: Configure the Conditions
- Step 4: Configure Notifications (SNS)
- Step 5: Name and Create the Alarm
- Testing the Alarm
- The Limits of Basic Monitoring
- What Basic Monitoring Can’t Show You
- Wrap-up
- References
I Launched an EC2 Instance — How Do I Know If the Server Dies?
In the previous post, I set up Ubuntu on a t3.micro and got WordPress and MySQL running with Docker Compose. The blog seems to be humming along, but then a thought hits me:
“What if the CPU hits 100%? What if the disk fills up? What if the server just stops while I’m not looking?”
On an on-premises server you would have to install monitoring tools yourself, but AWS is different. The moment you create an EC2 instance, basic monitoring starts automatically. In this post I’ll cover how to check server health using the EC2 monitoring tab and CloudWatch, all the way to getting an alarm when something goes wrong.
A Look at the EC2 Monitoring Tab
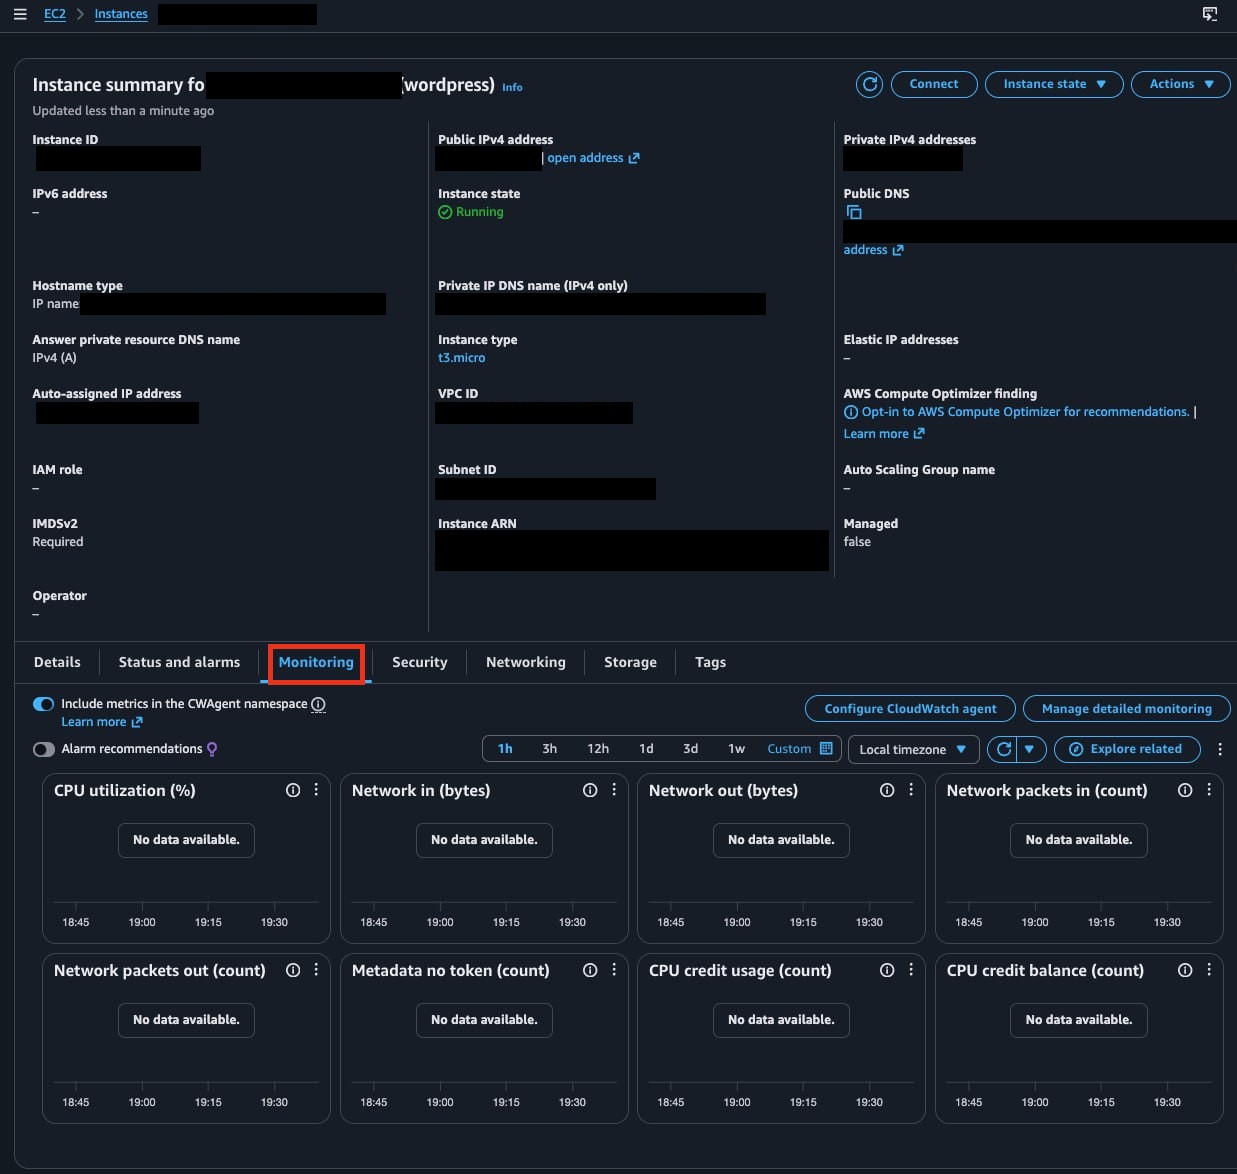
Select an EC2 instance and you’ll find a Monitoring tab at the bottom. Without any setup, you can immediately see the metrics AWS collects automatically.
Metrics Provided by Default
| Metric | Description |
|---|---|
| CPU utilization (CPUUtilization) | Percentage of the instance’s CPU in use |
| Network in/out (NetworkIn/Out) | Network traffic in bytes |
| Disk read/write ops (DiskReadOps/WriteOps) | Number of disk I/O operations |
| Disk read/write bytes | Amount of disk I/O data |
| Status checks (StatusCheckFailed) | Instance and system status |
Basic monitoring collects data at 5-minute intervals and comes at no extra cost.
💡 Disk I/O is not disk capacity
The “disk read/write” metrics provided by default measure read/write activity. Disk capacity information like “80GB used out of 100GB” is not part of basic monitoring. To see disk usage and memory utilization you need to install the CloudWatch Agent, which is covered in Part 2.
Basic Monitoring vs. Detailed Monitoring
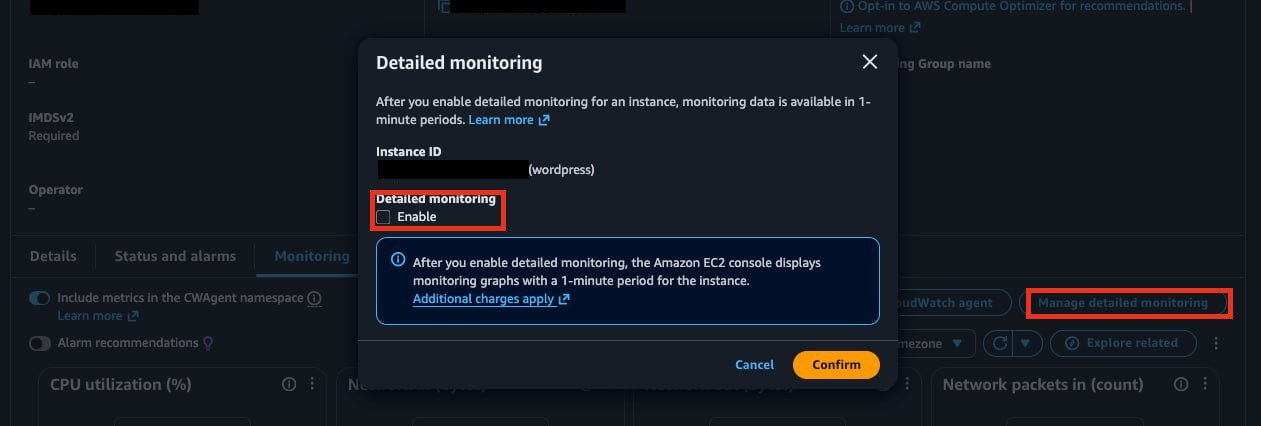
You’ve probably noticed the Manage detailed monitoring button in the monitoring tab. Click it and you’re greeted with a warning that “additional charges apply”.
What’s Actually Different
| Basic monitoring | Detailed monitoring | |
|---|---|---|
| Data collection interval | 5 minutes | 1 minute |
| Cost | Free | Paid |
| How it’s enabled | Default (automatic) | Must be enabled manually |
| Metrics collected | CPU, network, disk I/O, etc. | Identical |
The key takeaway: detailed monitoring doesn’t give you “more information” — it collects the same information more often (at 1-minute intervals). (AWS official docs)
What Detailed Monitoring Costs
Enable detailed monitoring and the default metrics are billed at the custom metric rate. (CloudWatch pricing page)
- Default metrics per EC2 instance: about 7
- Cost per metric: $0.30/month (for the first 10,000 metrics)
- For a single t3.micro: 7 × $0.30 = about $2.10/month
💡 When detailed monitoring makes sense
If you run a production environment that has to react to traffic in real time, or you use Auto Scaling, 1-minute detailed monitoring is worth it. For a personal blog or a dev server, though, 5-minute basic monitoring is plenty.
What Is CloudWatch?
The graphs you saw in the EC2 monitoring tab actually come from a service called Amazon CloudWatch. CloudWatch is AWS’s unified monitoring platform, and it does quite a bit more than just display data.
CloudWatch’s Core Features
| Feature | Description |
|---|---|
| Metric collection | Automatically collects performance data from AWS services |
| Dashboards | Visualize multiple metrics on a single screen |
| Alarms | Send notifications or take automated action when a threshold is crossed |
| Log management | Centralized collection and analysis of application logs |
Understanding the EC2 Monitoring Architecture
flowchart TB
    subgraph EC2["🖥️ EC2 instance"]
        direction LR
        subgraph BASIC["Basic monitoring"]
            B0("Hypervisor level · automatic · free")
            B1["✅ CPU utilization"]
            B2["✅ Network I/O"]
            B3["✅ Disk I/O"]
            B4["✅ Status checks"]
        end
        subgraph AGENT["CloudWatch Agent"]
            A0("Inside the OS · separate install required")
            A1["✨ Memory usage"]
            A2["✨ Disk capacity"]
            A3["✨ Process monitoring"]
            A4["✨ Custom log collection"]
        end
    end
    subgraph CW["☁️ Amazon CloudWatch — AWS unified monitoring platform"]
        C1["Metric storage · visualization · dashboards · alarms"]
    end
    BASIC -->|sent automatically every 5 minutes| CW
    AGENT -->|metrics sent per your config| CW
Basic monitoring metrics are collected at the AWS infrastructure (hypervisor) level. That’s why OS-internal information like memory usage and disk capacity isn’t provided by default. To collect it, you have to install the CloudWatch Agent inside the instance.
💡 The CloudWatch Agent is covered in Part 2
In this post we’ll get comfortable with basic monitoring and the CloudWatch console first; installing the Agent is covered in detail in the next post.
Understanding the CloudWatch Free Tier
“Doesn’t using CloudWatch cost money?” — a fair worry. Fortunately, CloudWatch comes with a fairly generous Free Tier. (CloudWatch pricing page)
CloudWatch Free Tier (Always Free)
| Item | Free allowance | Description | Notes |
|---|---|---|---|
| Basic monitoring metrics | Unlimited | Default metrics for AWS services like EC2 and S3 | – |
| Custom metrics | 10/month | User-defined metrics | Used once the Agent is installed |
| Alarms | 10 | Standard-resolution alarms | – |
| Dashboards | 3 | Up to 50 metrics each | – |
| API requests | 1 million/month | GetMetricStatistics, etc. | – |
| Log ingestion | 5GB/month | Total monthly ingestion; $0.50/GB beyond that | Used once the Agent is installed |
| Log storage | 5GB/month | Monthly storage; $0.03/GB beyond that | Used once the Agent is installed |
If you’re running a personal blog on a single t3.micro, you can comfortably monitor it within the free tier.
💡 The log Free Tier in detail
“5GB ingestion, 5GB storage” is a monthly total. For example, if you ship 200MB of logs per day, that’s about 6GB a month, and you’d be charged $0.50 for the 1GB overage. Logs aren’t automatically deleted once you pass 5GB — you’re billed for the excess. Log retention has to be configured separately; if you don’t set it, logs are kept indefinitely and storage costs keep piling up.
💡 When you do get charged
Costs kick in when you enable detailed monitoring, add custom metrics via the CloudWatch Agent (11 or more), or create more than 10 alarms. For a small setup, though, you’ll mostly stay within the free tier.
Checking Metrics in the CloudWatch Console
Now let’s look at EC2 metrics directly in the CloudWatch console.
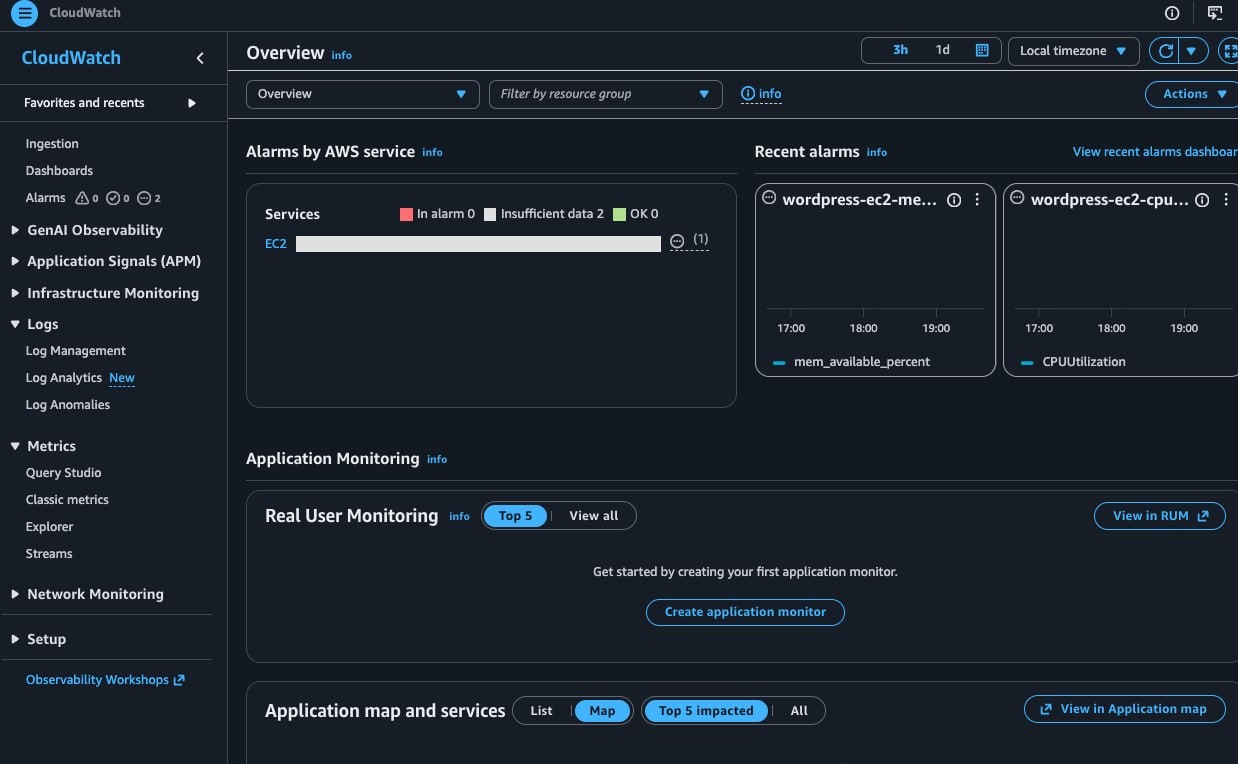
Opening the CloudWatch Console
- Type CloudWatch into the search bar at the top of the AWS console
- Click the CloudWatch service
Finding EC2 Metrics
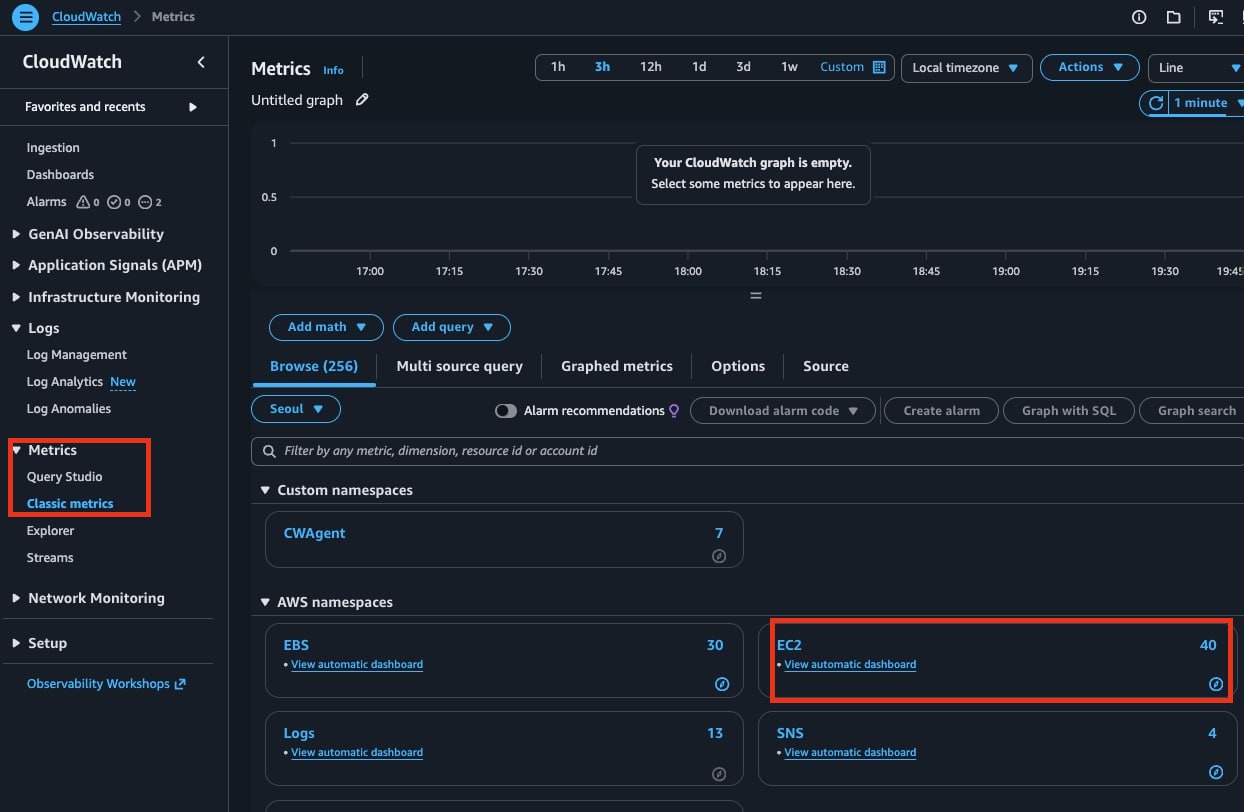
- In the left menu, click Metrics > Classic metrics (formerly All metrics)
- Under AWS namespaces at the bottom, select EC2
- Click Per-Instance Metrics
Viewing the CPU Utilization Graph
- Enter your instance ID in the search box (you can find it in the EC2 console)
- Check the CPUUtilization metric checkbox
- The graph appears at the top
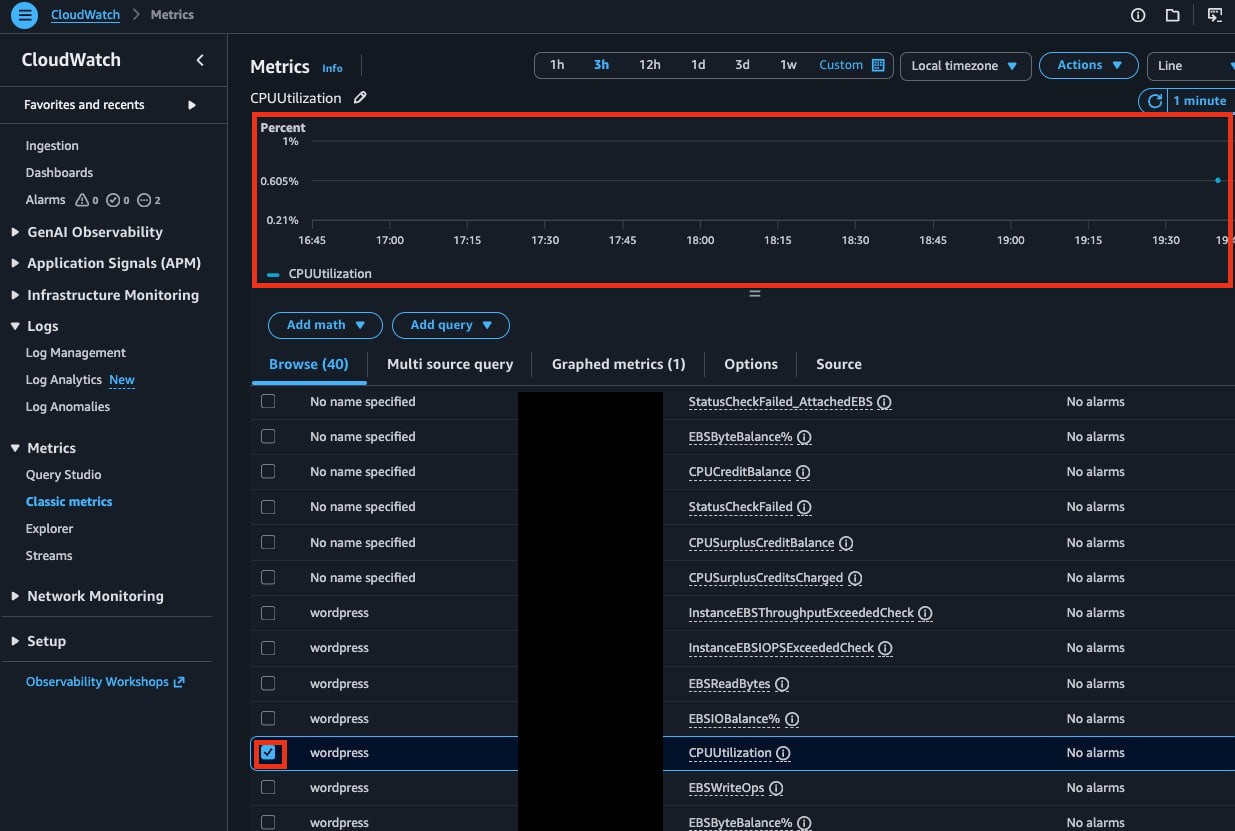
Adjust the time range at the top of the graph to see data for 1 hour, 3 hours, 12 hours, 1 day, 1 week, or whatever period you need.
💡 Want to see several metrics at once?
Check multiple metric checkboxes and they’ll all be plotted on a single graph. Handy for viewing network in/out together, or comparing CPU across several instances.
Creating a CPU Utilization Alarm
The whole point of monitoring is knowing immediately when something goes wrong. Set up a CloudWatch alarm and you’ll get an email when CPU crosses 80%.
Step 1: Start Creating the Alarm
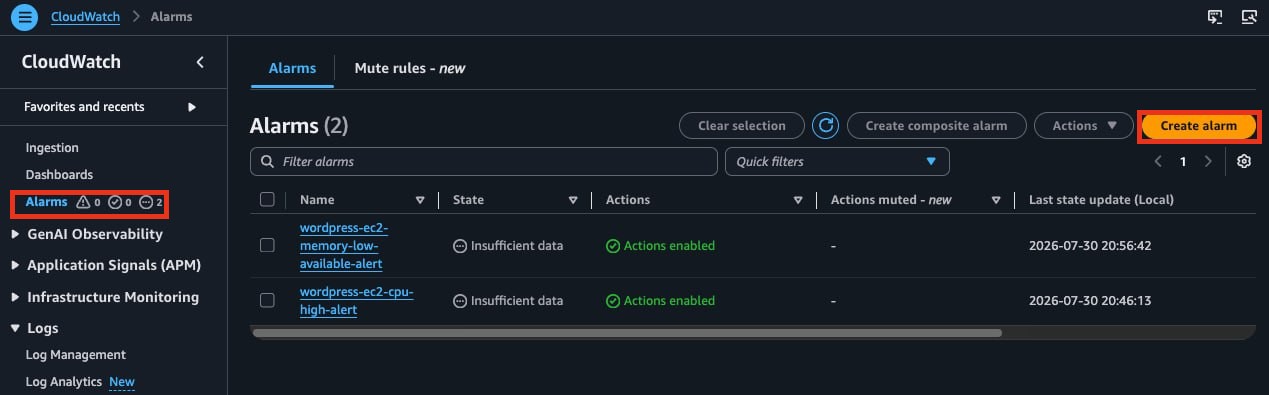
- In the CloudWatch left menu, click Alarms > All alarms
- Click the Create alarm button
- Click Select metric
Step 2: Select the Metric
- Choose EC2 > Per-Instance Metrics
- Select CPUUtilization for the instance you want to monitor
- Click the Select metric button
Step 3: Configure the Conditions
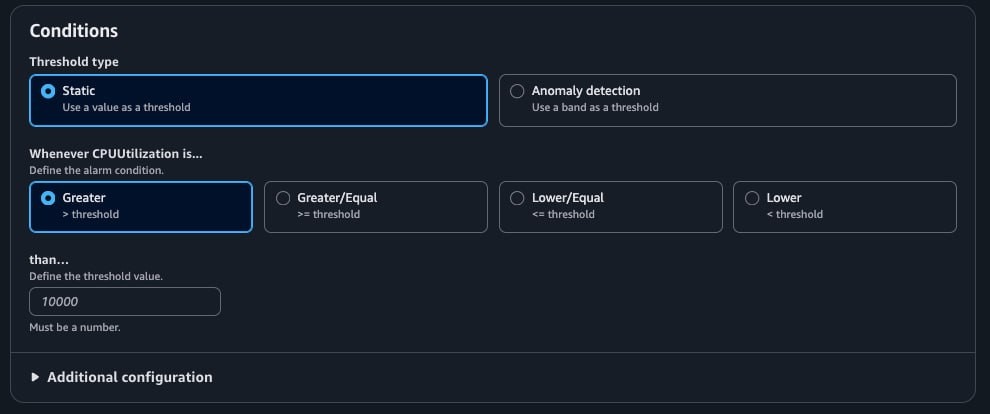
| Setting | Recommended value | Description |
|---|---|---|
| Threshold type | Static | Compare against a fixed value |
| Condition | Greater | Alarm when the threshold is exceeded |
| Threshold | 80 | When CPU exceeds 80% |
| Datapoints to alarm | 1/1 | Alarm immediately after a single breach |
💡 A tip on datapoints
“1/1” means one breach in one measurement fires the alarm immediately — so even a momentary spike can page you. Set it to “3/5” and the alarm only fires when 3 out of 5 measurements exceed the threshold, which cuts down on noise.
Step 4: Configure Notifications (SNS)
To receive an email when the alarm fires, you need to create an SNS (Simple Notification Service) topic.
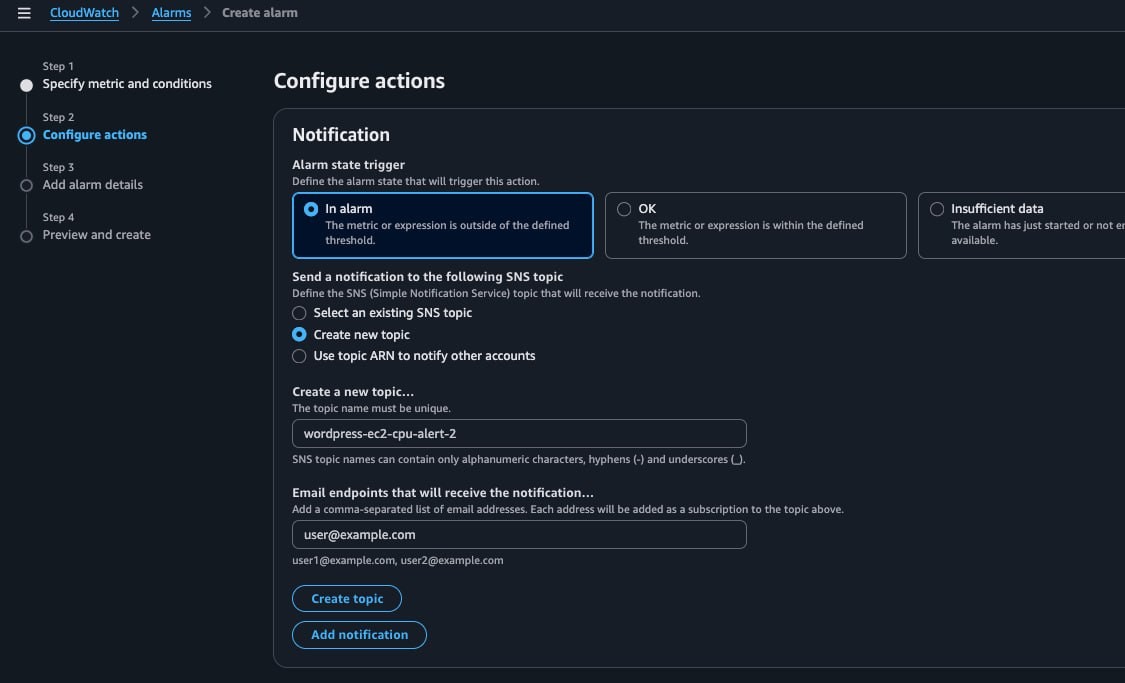
- Alarm state trigger: select “In alarm”
- SNS topic: choose “Create new topic”
- Topic name: enter
wordpress-ec2-cpu-alert - Email endpoint: enter your email address
⚠️ Don’t skip the email subscription confirmation!
When the SNS topic is created, a subscription confirmation email is sent to the address you entered. You have to open it and click the Confirm subscription link to actually receive notifications. Check your spam folder too.
Step 5: Name and Create the Alarm
- Alarm name:
wordpress-ec2-cpu-high-alert(something easy to recognize) - Alarm description: “Alarm when EC2 CPU utilization exceeds 80%” (optional)
- Click Next > Create alarm
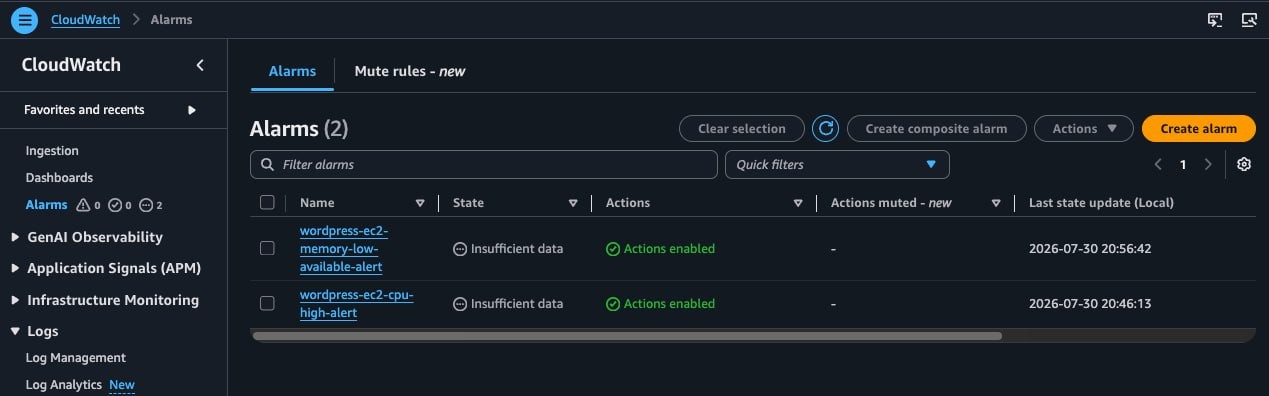
Once created, the alarm shows up in the alarm list. If your CPU is currently below 80%, the state reads “OK”.
Testing the Alarm
If you want to confirm the alarm actually works, SSH into the EC2 instance and generate some CPU load.
# Generate CPU load (stop with Ctrl+C after testing)yes > /dev/null &yes > /dev/null &
# Stop the loadkillall yes
💡 About the yes and killall commands
yes: a command that prints “y” in an infinite loop. Redirecting the output to> /dev/nullthrows it away, leaving nothing but CPU burn. Appending&runs it in the background.killall yes: terminates every runningyesprocess.killallkills processes by name.- A t3.micro has 2 vCPUs, so running two
yesprocesses pushes CPU close to 100%.
After a short wait, if the alarm notification lands in your inbox, everything is set up correctly.
The Limits of Basic Monitoring
If you’ve followed along this far, you now have EC2 basic monitoring and a CloudWatch alarm in place. But the information you actually care about most when running a server might be something else entirely.
What Basic Monitoring Can’t Show You
| What you need | Included by default | Solution |
|---|---|---|
| Memory usage | ❌ | CloudWatch Agent |
| Disk capacity (free space) | ❌ | CloudWatch Agent |
| Status of a specific process | ❌ | CloudWatch Agent |
| Application logs | ❌ | CloudWatch Agent |
Because basic monitoring collects data at the AWS hypervisor level, it provides no OS-internal information. A server slowing down from memory pressure, or logs failing to write because the disk is full — basic monitoring alone can’t detect either.
💡 Coming up next: memory/disk monitoring with the CloudWatch Agent
In Part 2, I’ll install the CloudWatch Agent on an Ubuntu EC2 instance and monitor memory usage and disk capacity — including setting up an alarm for memory above 80%.
Wrap-up
Here’s a recap of what this post covered.
EC2 basic monitoring starts automatically the moment an instance is created, providing CPU utilization, network I/O, disk I/O, and status check metrics at 5-minute intervals, free of charge.
Detailed monitoring collects the same metrics at 1-minute intervals and costs $0.30/month per metric. For a personal blog or a dev server, basic monitoring is enough.
CloudWatch is AWS’s unified monitoring platform, offering metric visualization, dashboards, and alarms. The Free Tier gives you up to 10 alarms and 3 dashboards at no cost.
CloudWatch alarms notify you by email when a metric like CPU crosses a threshold. You need to create an SNS topic and confirm the email subscription.
Memory and disk capacity are not part of basic monitoring. They require the CloudWatch Agent, which is covered in Part 2.
References
- Monitor Amazon EC2 resources – AWS official docs
- Manage detailed monitoring for EC2 instances – AWS official docs
- Monitor instances using CloudWatch – AWS official docs
- Amazon CloudWatch pricing
- CloudWatch Pricing Explained: Ultimate Guide 2025 – Cloudchipr