In Part 1 of this monitoring guide I set up EC2 basic monitoring and CloudWatch alarms. But once you actually run a server, the questions you care about most are different:
“How much memory is left? What happens when the disk fills up?”
If you’re running WordPress and MySQL in Docker on an instance with only 1GB of memory, like a t3.micro, running out of memory is a very real concern. Yet EC2 basic monitoring does not provide memory usage or disk capacity at all.
In this post I’ll install the CloudWatch Agent and set up monitoring for memory, disk capacity, and even swap memory.
What Is the CloudWatch Agent?
The CloudWatch Agent is a program you install inside the EC2 instance. It collects system information at the OS level and sends it to CloudWatch.
Basic Monitoring vs CloudWatch Agent
Basic monitoring
CloudWatch Agent
Installation
Not needed (automatic)
Manual install required
Collected from
Hypervisor (AWS infrastructure)
Inside the OS
Memory usage
❌
✅
Disk capacity
❌
✅
Swap memory
❌
✅
Process monitoring
❌
✅
Log collection
❌
✅
Basic monitoring collects data at the AWS infrastructure level, so it has no visibility into the OS. The CloudWatch Agent runs inside the instance, reads system information directly from places like /proc/meminfo and /proc/diskstats, and ships it to CloudWatch.
Agent Resource Usage on a t3.micro
“Won’t installing the agent slow my server down?”
If you’re on a small instance like a t3.micro (2 vCPUs, 1GB memory), that’s a fair concern. Here’s what the actual resource usage looks like:
Configuration
CPU usage
Memory usage
Metrics only
1-5%
~50-100MB
Metrics + logs (absolute paths)
5-10%
~100-150MB
Metrics + logs with wildcards (**/*.log)
15-40%+
200MB+ ⚠️
If you’re only collecting metrics, it runs perfectly fine on a t3.micro. The memory/disk/CPU/swap metric collection covered in this post is lightweight work.
💡 Tips for keeping resource usage low
Set metrics_collection_interval to 60 seconds or more (the default is 60)
For log collection, use absolute paths instead of wildcards (*)
Only collect the metrics you actually need
Checking the Agent’s Resource Usage Yourself
After installing the agent, you can verify how much it actually consumes.
Terminal window
# Option 1: check with ps
psaux|grepamazon-cloudwatch-agent|grep-vgrep
# Option 2: watch it live in top (press q to quit)
top-p $(pgrep-d','amazon-cloudwatch)
# Option 3: install htop (easier to read)
sudoaptinstallhtop-y
htop
💡 About those pgrep options
-f: Linux only stores the first 15 characters of a process name. amazon-cloudwatch-agent is longer than 15 characters, so you need -f to search the full command line.
-d',': prints multiple PIDs separated by commas. top -p expects comma-separated PIDs, which is why this is needed. (e.g. 1234,5678)
In htop, press F4 and filter by cloudwatch to see only the agent processes.
💡 Mac users
On the default Mac keyboard, F4 is mapped to a system function (Launchpad, etc.), so you may need to press fn + F4.
💡 Seeing multiple processes?
By default, htop shows threads as individual rows. If you see several rows but the RES (actual memory) and MEM% values are identical, those are threads sharing the same memory — the actual usage is only counted once. Press H to hide threads and view at the process level only.
Prerequisite: Create an IAM Role
For the CloudWatch Agent to send data to CloudWatch, it needs permissions. You have to create an IAM role and attach it to the EC2 instance.
Step 1: Create the IAM Role
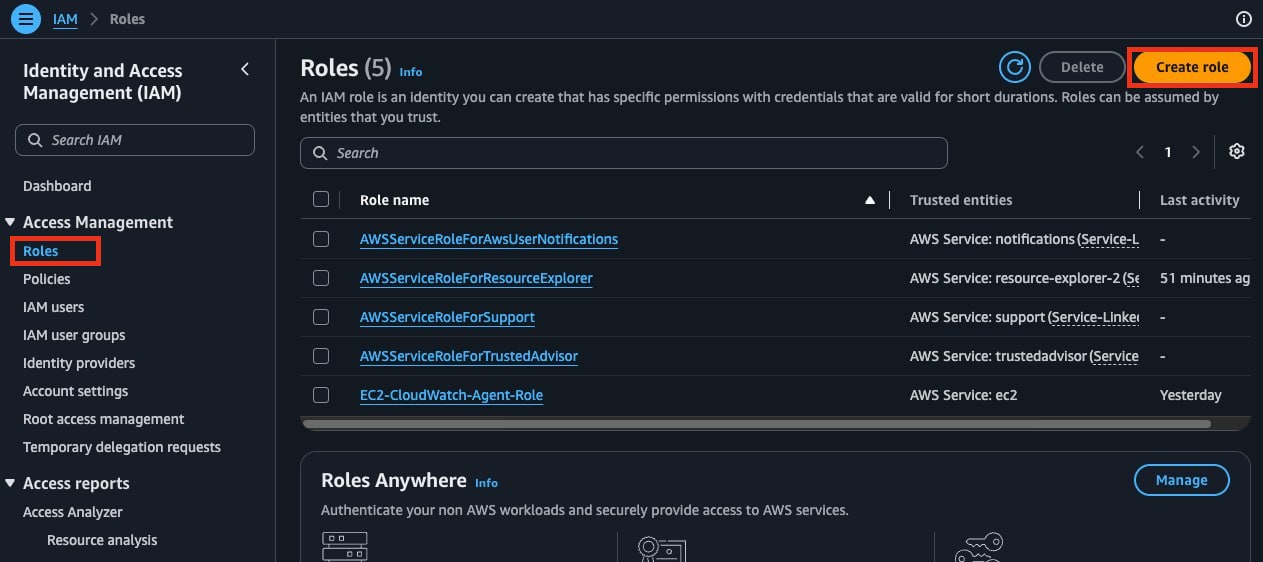
Go to the IAM service in the AWS console
Click Roles in the left menu
Click Create role
Trusted entity type: select AWS service
Use case: select EC2
Click Next
Step 2: Attach the Permission Policy
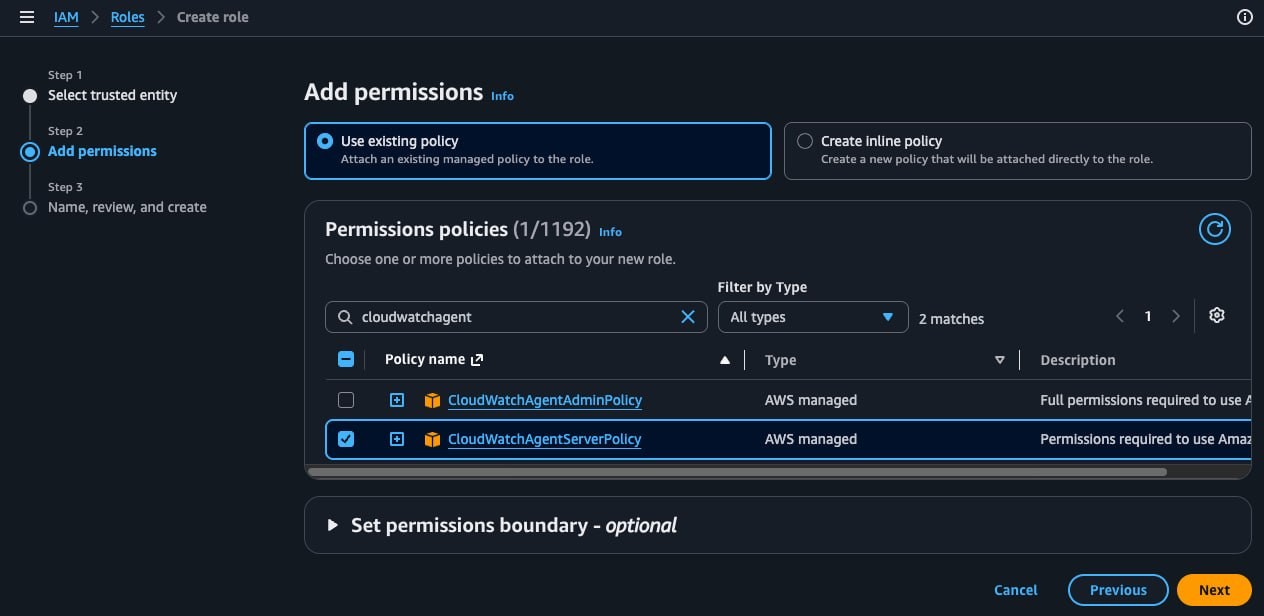
Type CloudWatchAgent in the search box
Check CloudWatchAgentServerPolicy
Click Next
💡 What CloudWatchAgentServerPolicy includes
This policy grants permission to write metrics/logs to CloudWatch (PutMetricData, PutLogEvents) and read EC2 tags (DescribeTags). It’s the minimum set of permissions the agent needs to run.
Step 3: Name and Create the Role
Role name: EC2-CloudWatch-Agent-Role (something easy to recognize)
Click Create role
Step 4: Attach the Role to EC2
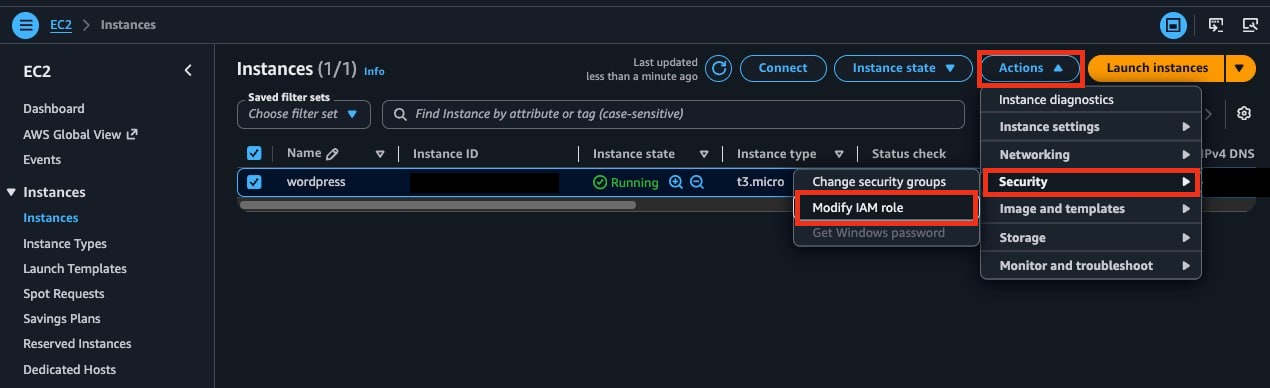
Go to the EC2 service
Select the target instance
Click Actions > Security > Modify IAM role
Select the role you just created
Click Update IAM role
Once attached, the role name appears under the IAM Role field in the EC2 instance details.
Installing the CloudWatch Agent (Ubuntu)
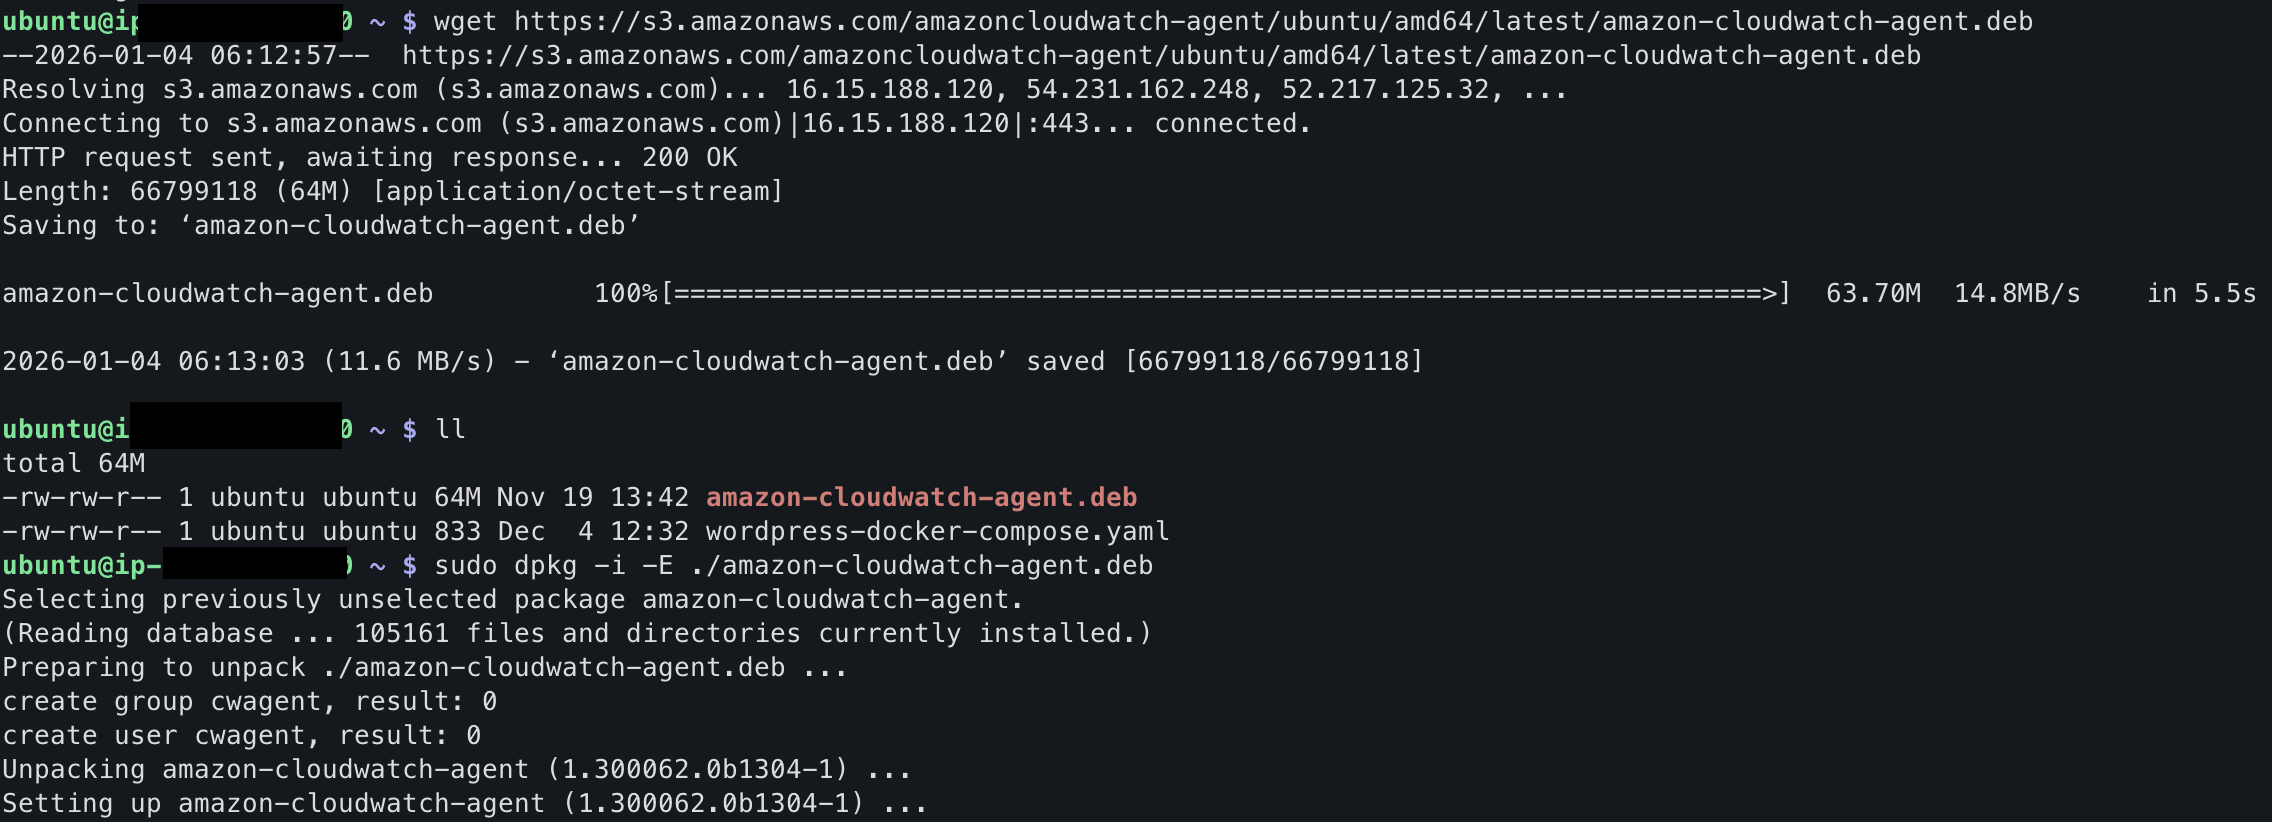
Now SSH into the EC2 instance and install the agent. These steps are for Ubuntu.
Once the install completes, the agent files land in /opt/aws/amazon-cloudwatch-agent/.
💡 Using a different architecture/OS?
If you’re on an ARM-based instance (Graviton), replace amd64 with arm64. Download links for other operating systems are listed in the AWS official docs↗.
Building the Configuration File
The agent reads a configuration file (config.json) to decide which metrics to collect.
Two Ways to Configure
Option 1: Use the configuration wizard (AWS docs↗)
You answer interactive questions in the CLI and it generates the config file for you. It runs in the terminal, not a web UI. Convenient, but there are a lot of options, so it takes a while.
Option 2: Write config.json by hand ✅ (used in this post) (AWS docs↗) You write only the settings you need. You can copy-paste it and be done — much faster.
If you don’t specify run_as_user, the CloudWatch Agent runs with the default: root privileges. Running as root lets it read most log files — /var/log/syslog, /var/log/auth.log, Docker logs, and so on — without any extra permission setup. (See the AWS docs↗)
Configuration Fields Explained
Field
Description
metrics_collection_interval
Metric collection interval in seconds. 60 recommended
namespace
The namespace where you’ll find the metrics in CloudWatch
append_dimensions
Dimensions added to each metric. InstanceId distinguishes instances
Metrics Being Collected
Category
Metric
Description
mem
mem_used_percent
Memory usage (%)
mem
mem_available_percent
Available memory (%)
disk
disk_used_percent
Disk usage (%)
disk
disk_free
Free disk space (bytes)
cpu
cpu_usage_active
Active CPU usage (%)
cpu
cpu_usage_idle
Idle CPU (%)
swap
swap_used_percent
Swap memory usage (%)
💡 About the disk resources setting
"resources": ["/"] means monitoring disk capacity for the root mount point. If subdirectories like /var and /home live on the same volume, they’re naturally included. This setting doesn’t crawl files — it measures capacity per mount point, just like the df -h command.
If you’ve attached an additional EBS volume mounted at /mnt/data, you need to specify "resources": ["/", "/mnt/data"] for that volume to be monitored too. Setting "resources": ["*"] collects every mount point, but the metric count grows and so can your bill.
💡 About totalcpu
"totalcpu": true collects the average across all CPUs. Setting it to false collects each core separately, which increases the metric count.
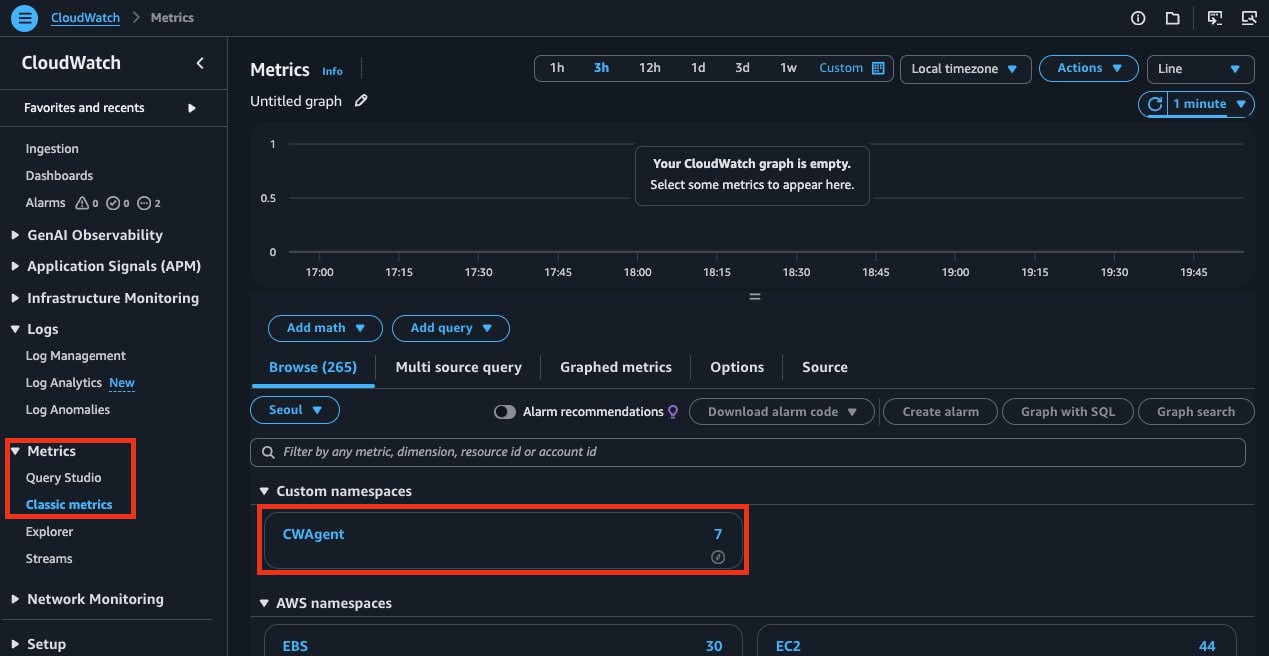
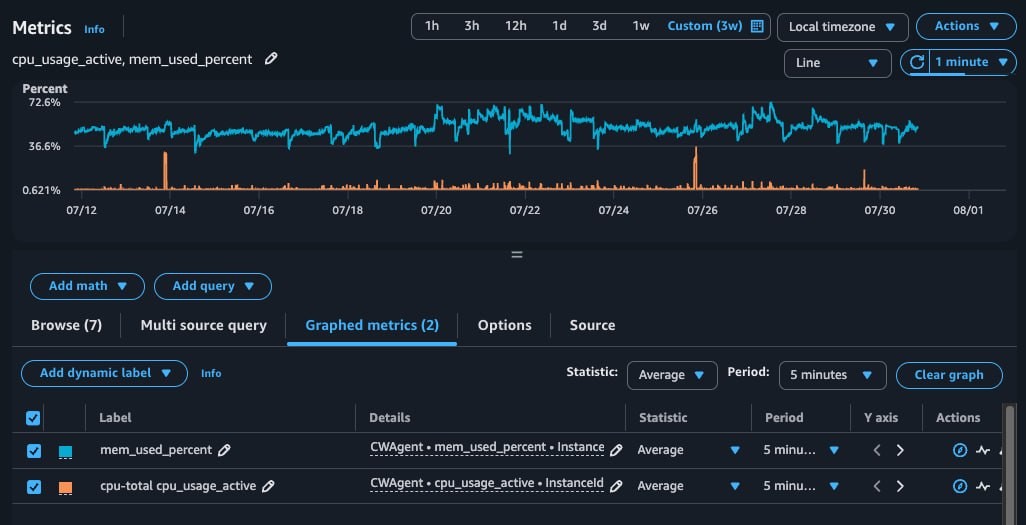
Click into each group and check the metrics you want to see them on the graph at the top.
At last — memory usage and disk capacity, the metrics you can’t see anywhere in the EC2 console, are now visible in CloudWatch!
Creating a Memory Alarm
Just like the CPU alarm in Part 1, let’s set up a memory alarm.
mem_used_percent vs mem_available_percent
Before creating the alarm, you need to decide which metric to base it on.
Metric
Meaning
buff/cache handling
mem_used_percent
Percentage of memory currently occupied
Included (even reclaimable memory counts as “used”)
mem_available_percent
Percentage of memory usable right now
Excluded (reclaimed on demand, so it counts as “available”)
Linux puts spare memory to work as buff/cache. That region is automatically released whenever an application requests memory. So even when mem_used_percent reads 80%, things are often perfectly fine.
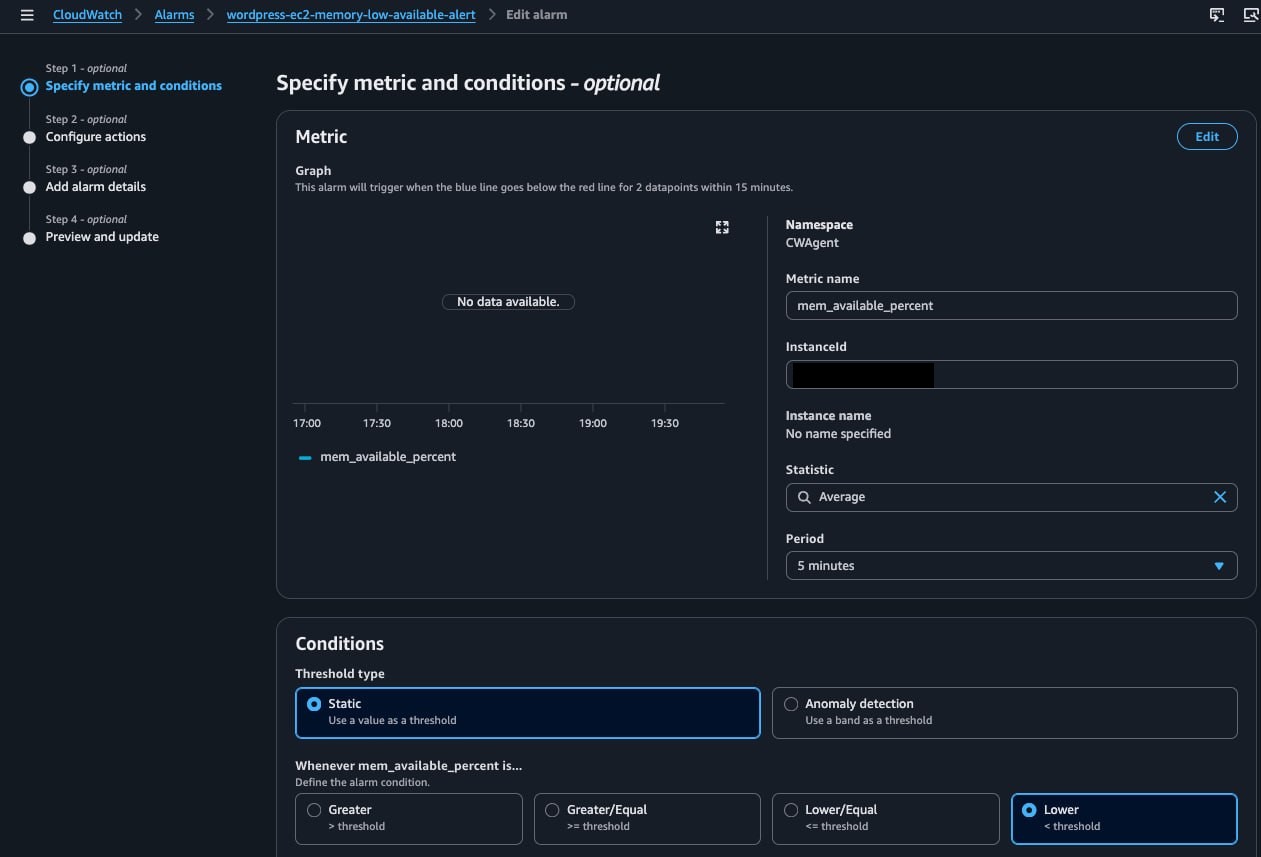
When mem_available_percent drops, it means “the memory you can actually use is running out” — so it detects real memory pressure much more accurately. On small-memory instances like a t3.micro, this metric is the more realistic choice.
Alarm when available memory drops below the threshold
Threshold
20
When available memory falls below 20%
Datapoints to alarm
2/3
Alarm when 2 out of 3 datapoints breach (reduces noise)
⚠️ Watch the condition direction
mem_used_percent is “dangerous when high,” so you’d use Greater than — but mem_available_percent is “dangerous when low,” so you use Lower than. Set the direction backwards and the alarm won’t work properly, so be careful.
Configure Notifications
Reuse the SNS topic you created in Part 1, or create a new one.
Alarm state trigger: select “In alarm”
SNS topic: select an existing topic or create a new one
Alarm name: EC2-Memory-Low-Available-Alert
Click Create alarm
A Note on Cost
The metrics collected by the CloudWatch Agent are classified as custom metrics, which can incur charges.
Free Tier Limits
Item
Free allowance
Custom metrics
10/month
Alarms
10
Metric Count for This Post’s Configuration
Metric
Count
mem_used_percent
1
mem_available_percent
1
disk_used_percent
1
disk_free
1
cpu_usage_active
1
cpu_usage_idle
1
swap_used_percent
1
Total
7
7 metrics stays within the Free Tier limit of 10. You can use this setup at no extra cost.
⚠️ When charges do apply
11 or more metrics: $0.30/metric/month for the overage
Agent installed on multiple instances: metrics are counted per instance
Collecting all disks with resources: ["*"]: metric count grows per mount point
If a role name is printed, you’re fine. A 404 error means no role is attached.
💡 What is 169.254.169.254?
It’s the address of the EC2 Instance Metadata Service (IMDS). From any EC2 instance, hitting this IP lets the instance look up information about itself (instance ID, IAM role, region, and so on). It’s a special link-local address AWS provides internally — the CloudWatch Agent uses it to fetch instance information too.
It used to be reachable with a plain curl (IMDSv1), but due to security vulnerabilities, recent instances default to the token-based IMDSv2. (AWS docs↗)
The CWAgent Namespace Doesn’t Appear
Check the agent status: make sure status is running
Check the config file syntax: a JSON syntax error stops the agent from collecting metrics
Check internet connectivity: the agent must be able to reach the CloudWatch endpoint
If the JSON prints back formatted without errors, the syntax is fine.
Wrap-up
A quick recap of what this post covered.
The CloudWatch Agent is a program installed inside EC2 that collects what basic monitoring doesn’t provide: memory usage, disk capacity, swap memory, and more.
The installation process goes: create an IAM role → attach it to EC2 → install the agent package → write the config file → start the agent.
Resource usage with metrics-only collection is around 1-5% CPU and 50-100MB of memory — perfectly manageable even on a t3.micro.
Cost stays within the Free Tier with this post’s configuration (7 metrics), so there are no extra charges.
Viewing the metrics happens in CloudWatch > Metrics > the CWAgent namespace, and you can set alarms on them exactly like you do with basic monitoring.